


We’re excited to announce that we’ve added new easy-to-use features to Squarespace Analytics. Each one has been designed to help you better understand your audience, drive more relevant traffic to your website, and ultimately help more visitors take action on your site.
Gain More Audience Insights
Our new Traffic Sources panel allows you to see what percentage of your visitors are arriving via search, social, or other referral channel. Use the Device Type filter to learn what percentage of your customers are coming from desktop, mobile, or tablet in each channel.
Track Growth Over Time
Measure your site’s growth by viewing the percentage change over the previous period under each key traffic and sales metric. This will allow you to benchmark your performance to the previous week, month, or year. If you’ve had a Squarespace site for several years, Analytics now gives you access to historical data as far back as 2014.
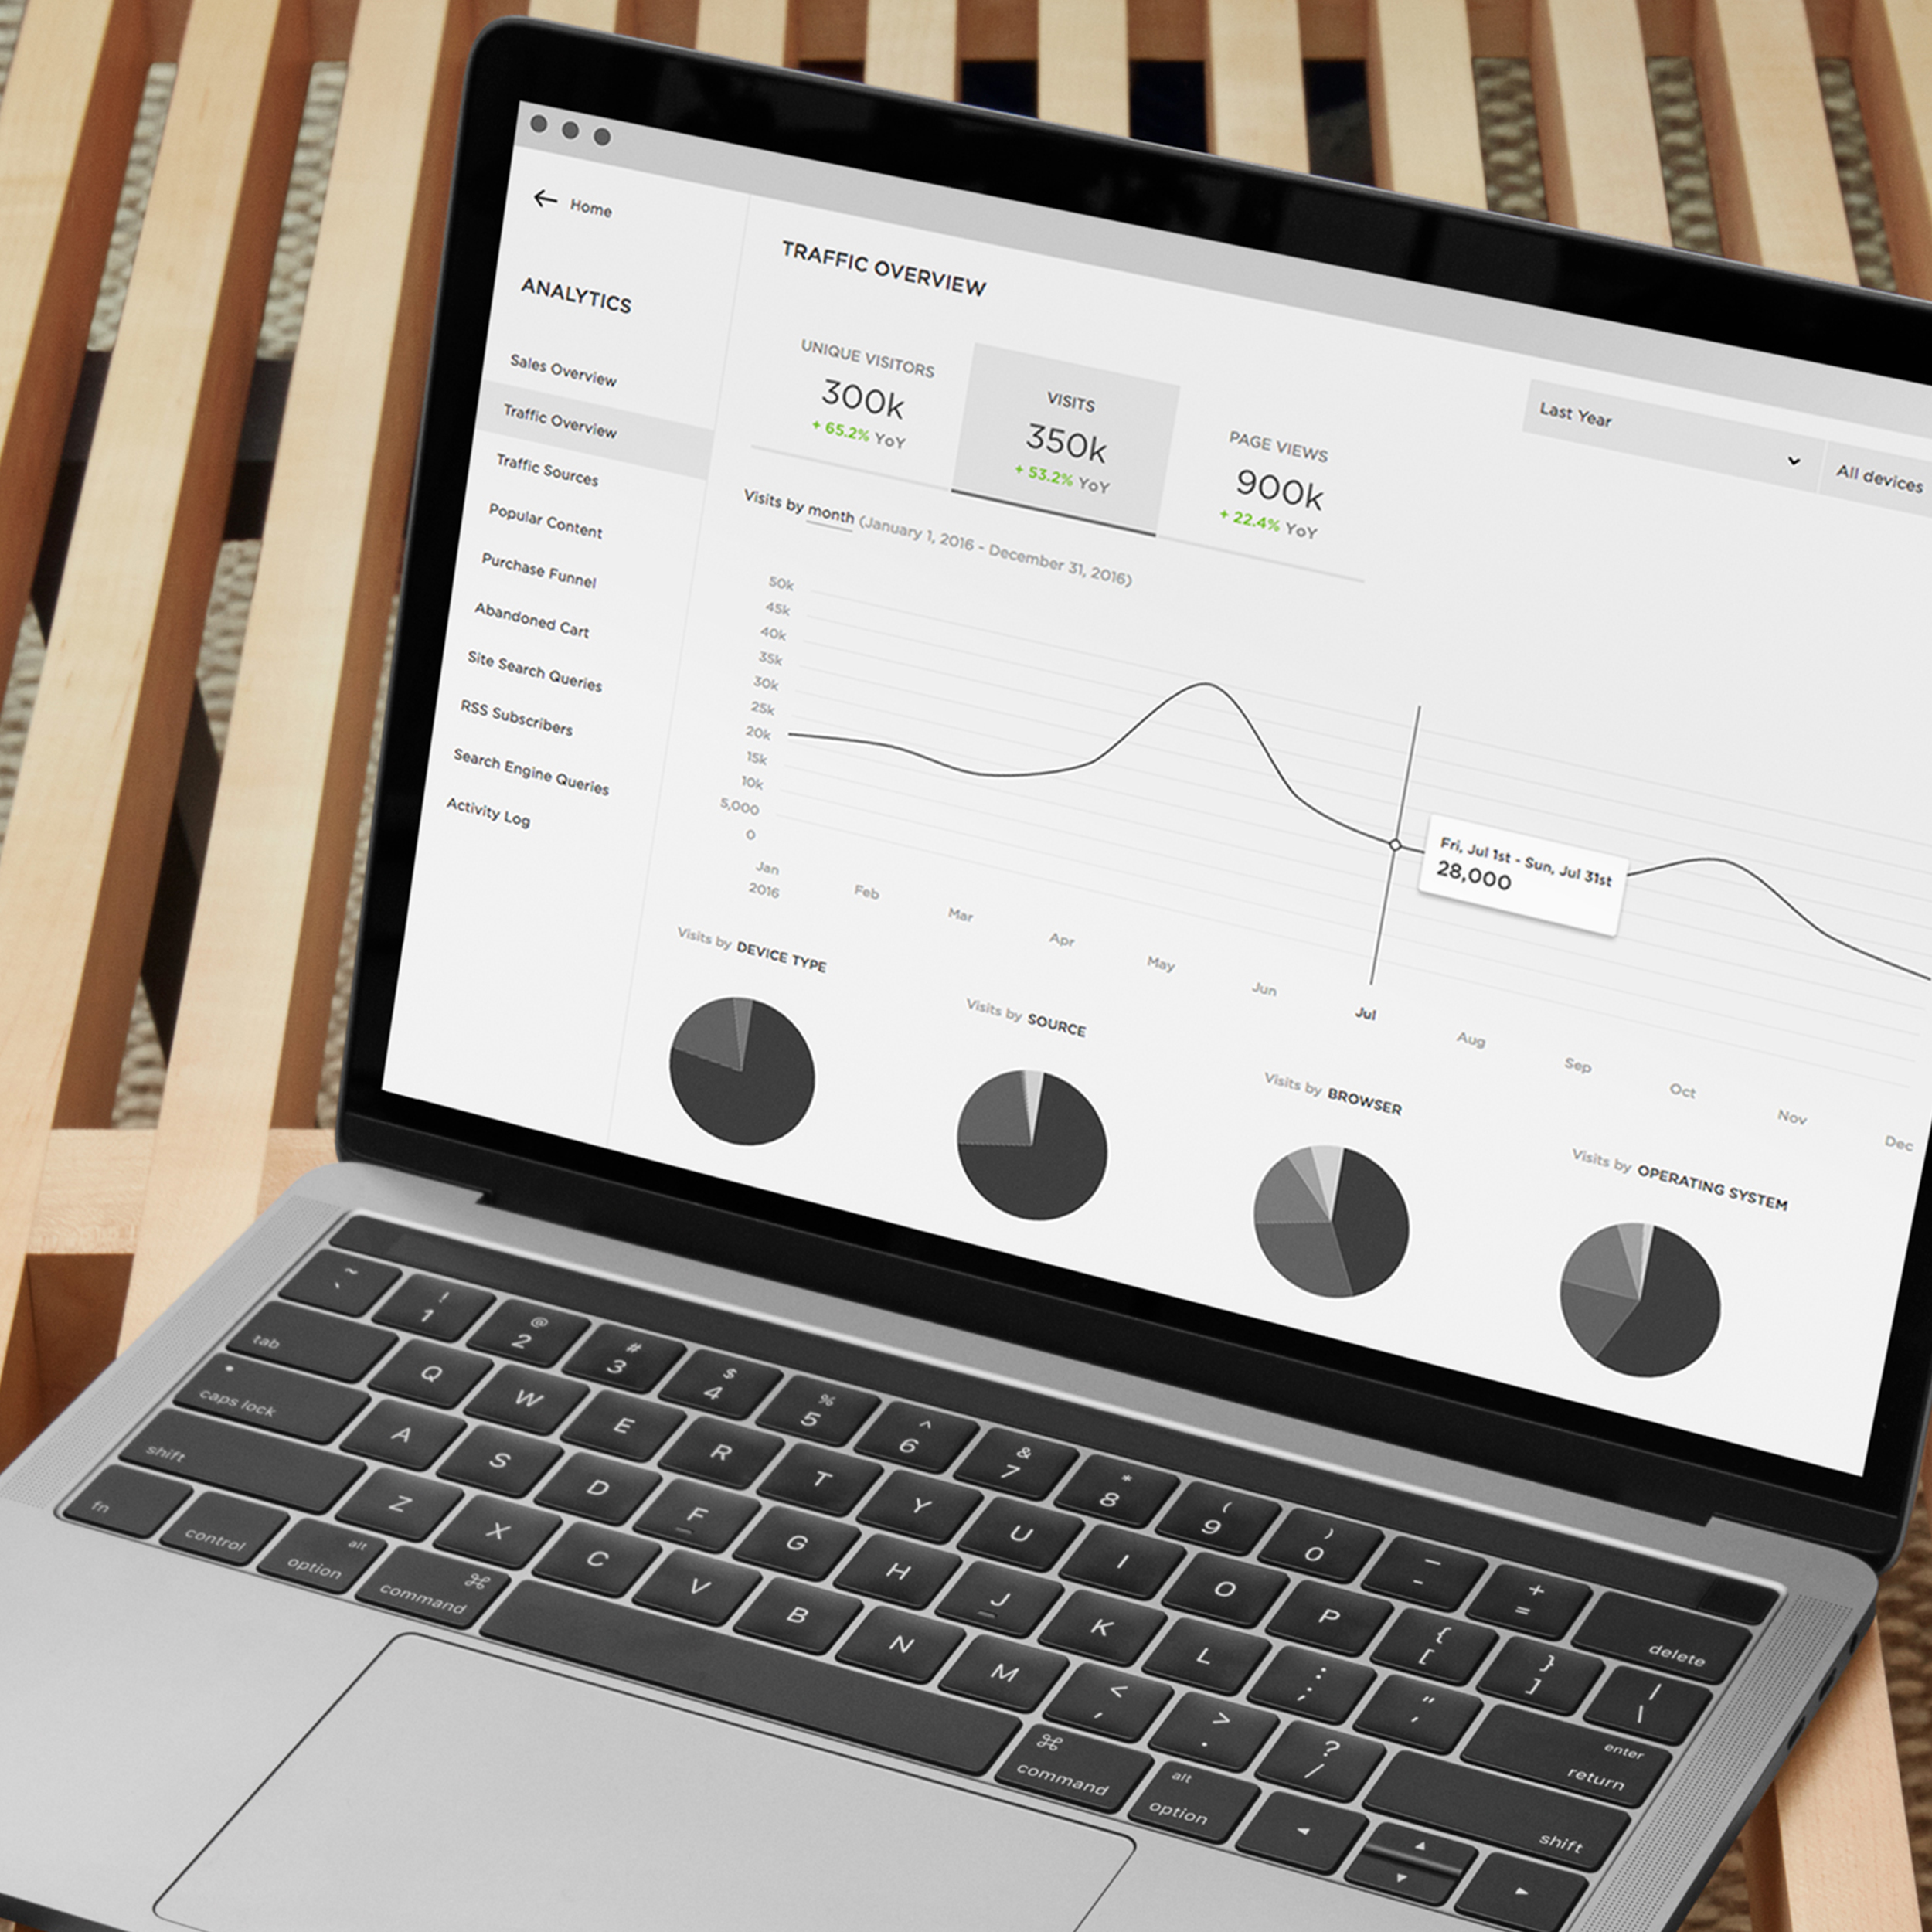
Identify Site Traffic Trends
Our dashboard now allows you to switch between viewing your traffic or sales by month, week, or day for any date range. This is especially helpful when looking at longer time periods to identify trends in your traffic and gain insight into the seasonality of your business or website. We’ve also added frequently used date ranges to the date picker to save you time.
Gain More Insight Into Your Sales
To help you learn more about your customer’s shopping habits while on your site, we’ve introduced key performance indicators including conversion rate, average order value, and revenue per visit to the Sales Overview panel in all plans. You’ll also be able to segment your sales by the top selling products, traffic sources, and device type so you can make meaningful decisions about your offerings.
If you have any questions about the new Analytics features, please contact our award-winning Customer Care Team.